


What Does Text Mining Do?
Daisho's text mining workflow builds a machine-learning model that automatically extracts topics or themes from your data. You can then use this model to tag each row of data to a collection of topics/themes. Once you do that, you can do all kinds of analysis on that. For example, you can see a time-based trend on topics, i.e., how have topics been growing/decreasing over time. Or you can compute mean of time-spent (assuming this is a column) for each extracted topic
What exactly do Topics/Themes mean?
Topics/themes in Daisho are collection of words that typically occur together statistically. Lets consider the example of newspaper articles. Articles related to politics tend to have a lot of words like elections, party, representative, bill, etc., while articles related to sports might have words like won, thrashed, out, scored, etc. The machine learning model tries to learn these distributions of words, and presents similarly occuring words to you as a single topic.
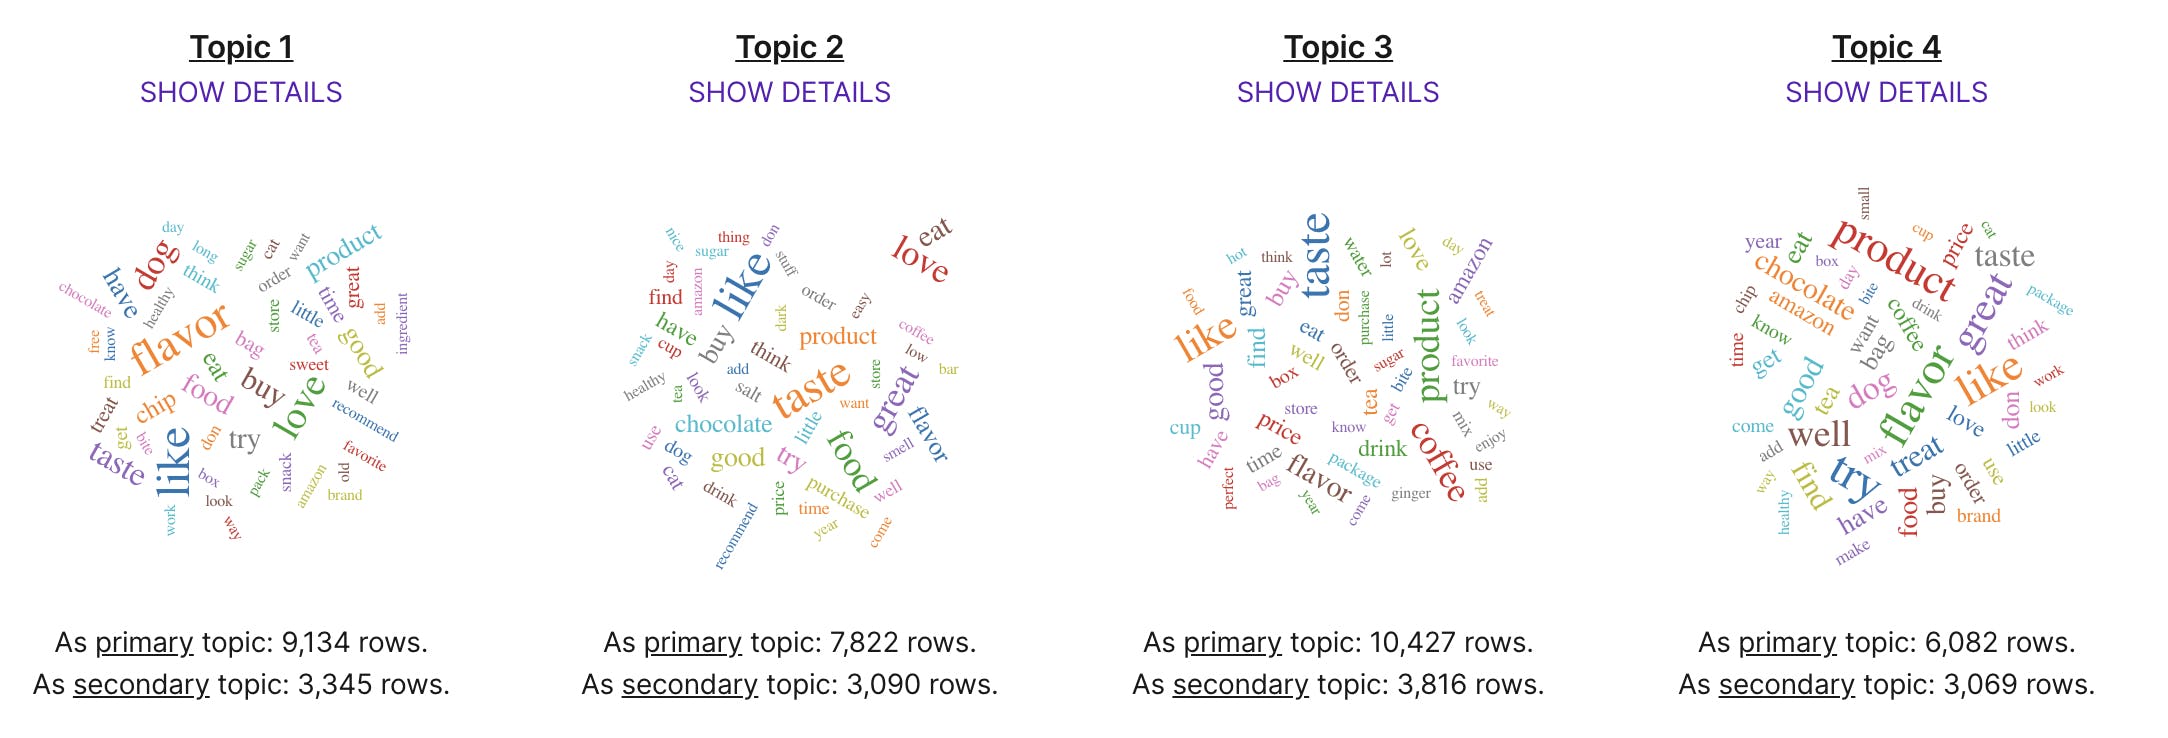
The above analysis was done on a set of 50,000 Amazon reviews. You can see what the machine picked up as the top words for each topic. For example, Topic 1 seems to be around flavor, and dog-food, while Topic 3 seems to be around Coffee, and a bunch of related things.
What Data do I need to have? And other Questions
All you need is data with your text column identified. You can even select upto 5 text columns, and the machine automatically joins them, and extracts topics from the resulting column.
Is there any pre-processing I need to do?
Daisho does standard pre-processing - stemming and lemmatization. For example, [take, took, takes] all get converted to take automatically. You don't need to bother about this. However, Daisho doesn't handle typos and spell-checks.
Can a document have multiple topics?
Absolutely. Behind the hood, Daisho computes the probability of each row (document) belonging to each topic. As a result, we commonly see documents getting categorised into more than one topic - and you get to see the weightage for each topic too.
I see primary topic and secondary topic in the example above. What are they?
Primary topic is the topic that the model believes is the strongest indicator for the row/document. Secondary topic is the next strongest. You are also likely to see several rows/documents where there's no secondary topic.
How about no topic?
Daisho handles that too. The model assigns zero/minimal weightage to topics which it thinks are highly unlikely. So, you will see rows where ALL topic weights are zero!
What's available now?
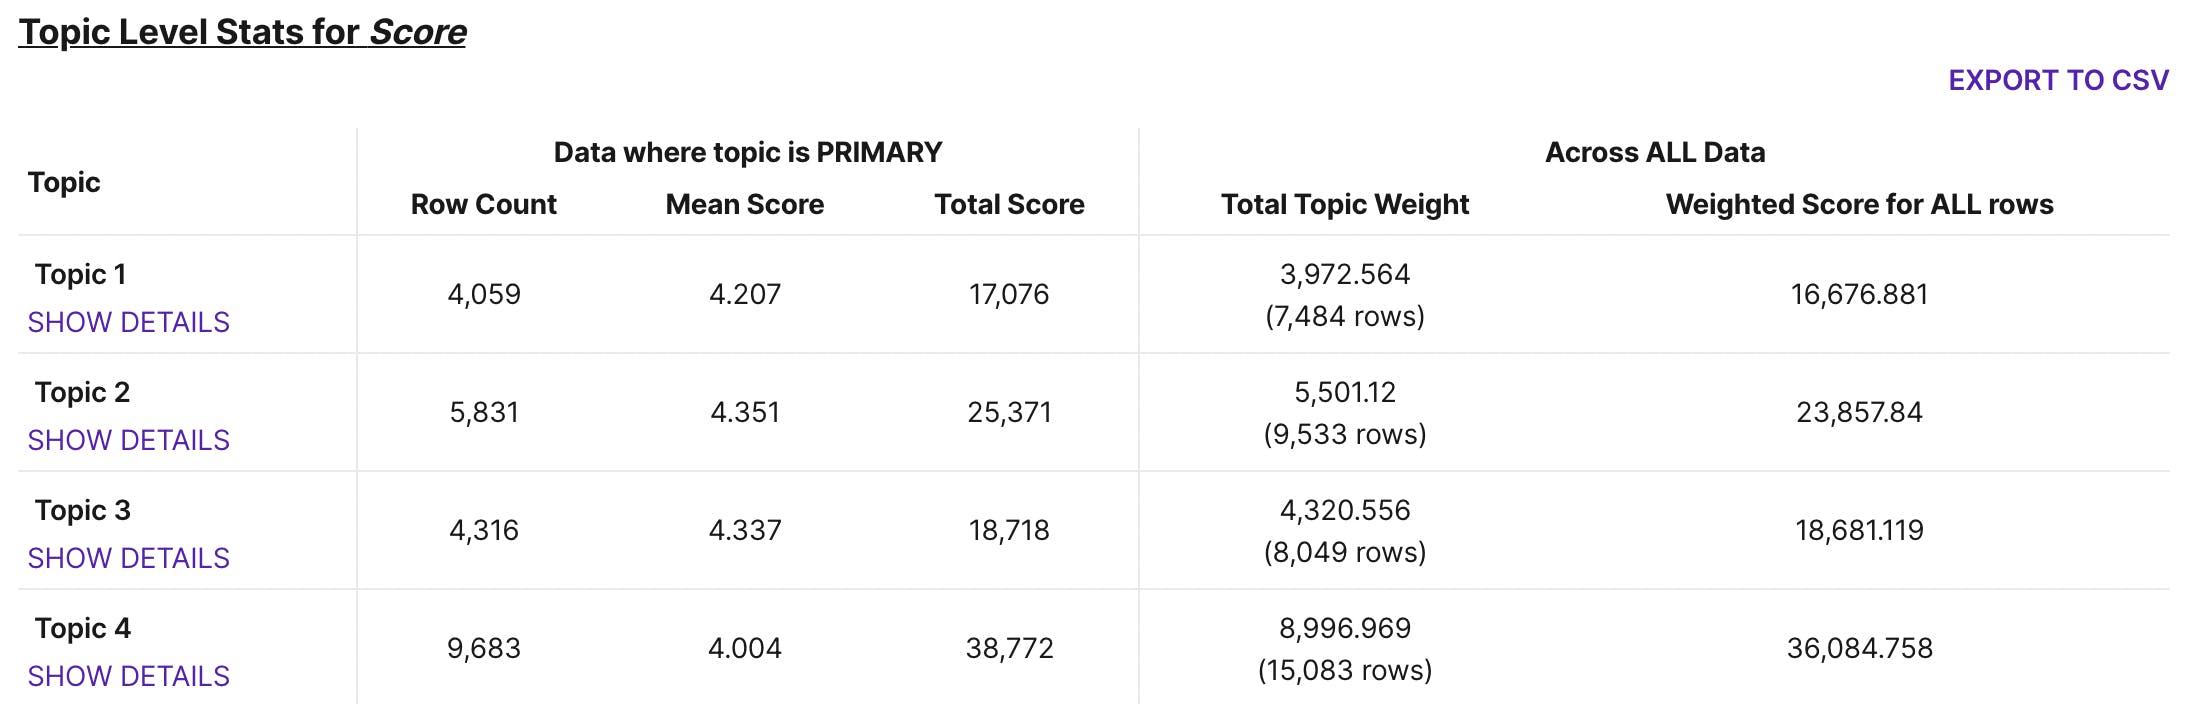
We got a bunch of insights ready currently - topic profiles, topic-level stats, and time-based trends. With topic-level stats, you can start answering questions like "what's the mean score (score is a column in data) for each topic?"
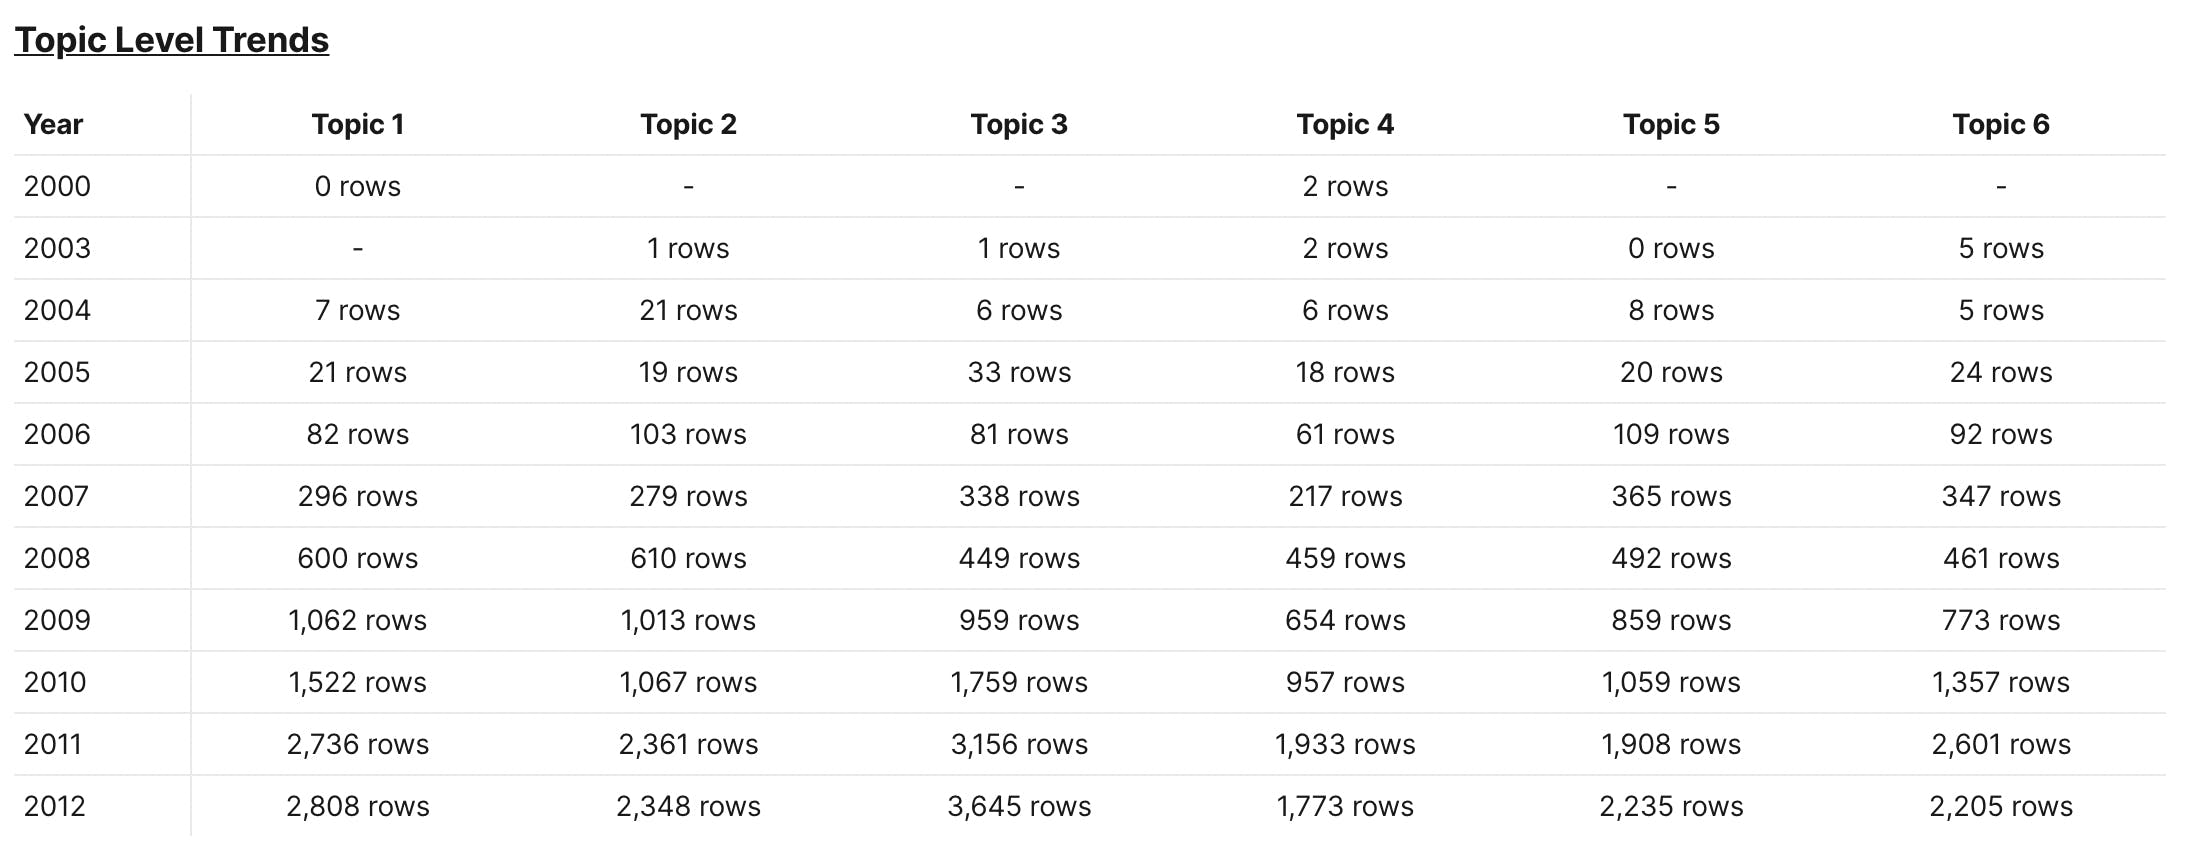
With time-based trends, you can answer questions like "how has topic distribution changed over time?":
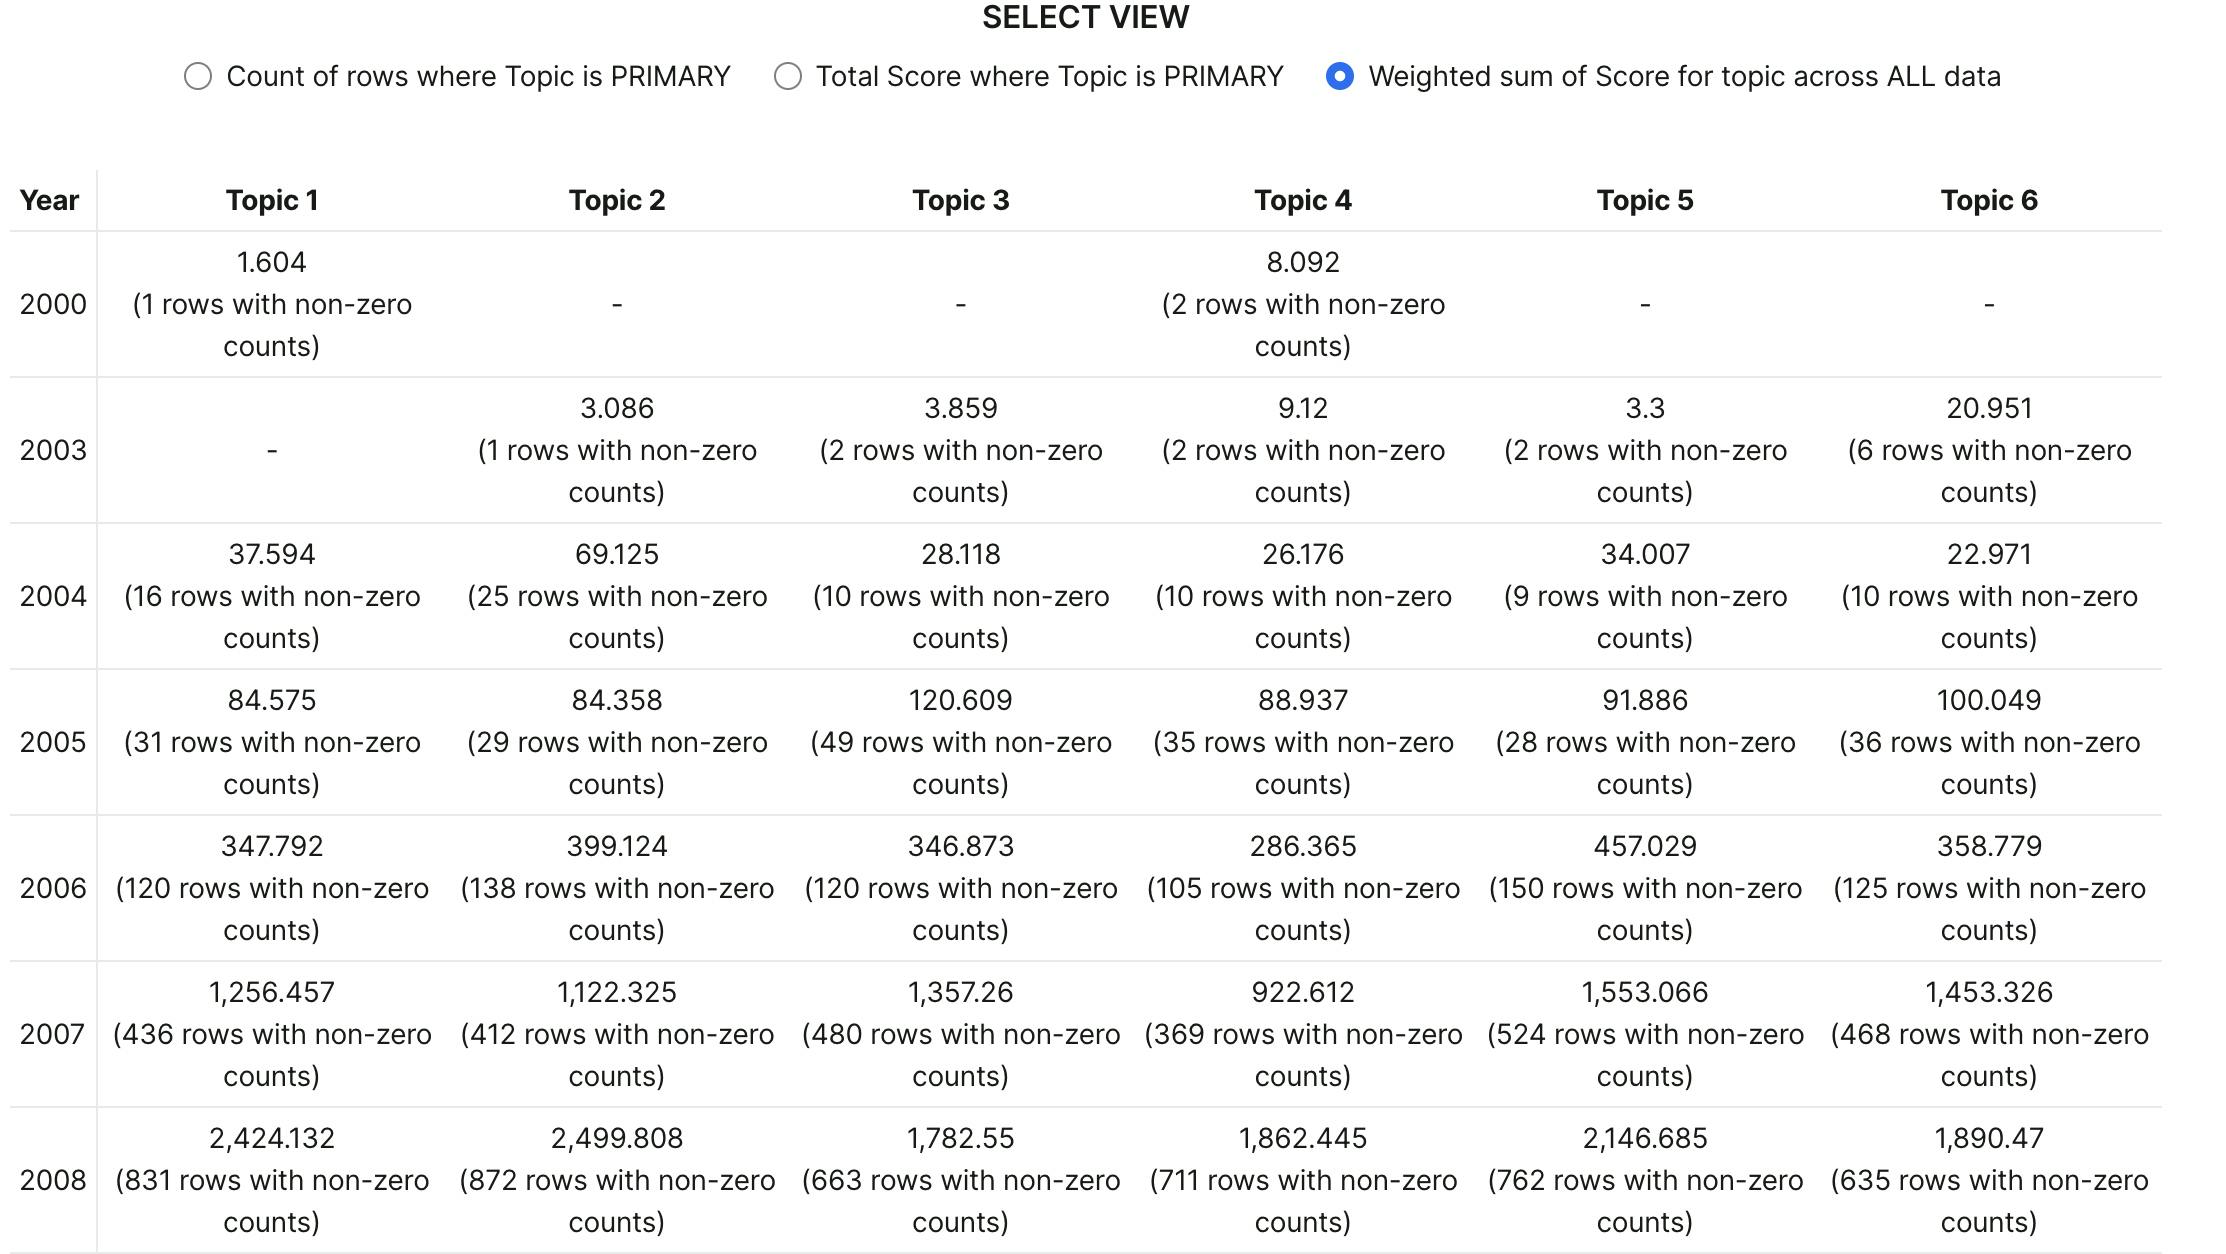
Or even: "how has values of column X for topics changed over time?":
You can also export Topic IDs and scores for uploaded data. And predictions and auto-learn are enabled too!!!